
Digital blindness: Learning to look at the digital conversation between two major bank brands and their audience using Python
New “digital” banks are rising in popularity in Brazil. It is hard to pinpoint the exact reasons for this, we may gain some insight on the subject by investigating data.
In this article we are going to dive deeper on tweets from two Brazilian banks: Itaú and Nubank. We will use Python to help us on this mission.
Cleaning the data
The Jupyter Notebook with the code is available here.
We start our journey with two datasets in JSON format. The data consists of tweets from both banks between 2014 and 2019 (February).
Let’s import one of the datasets and manipulate it with Pandas.
import pandas as pd
import numpy as np
import matplotlib.pyplot as plt
from wordcloud import WordCloud, STOPWORDS
df_nubank = pd.read_json(‘nubank_tweets.json’)
df_nubank.head()
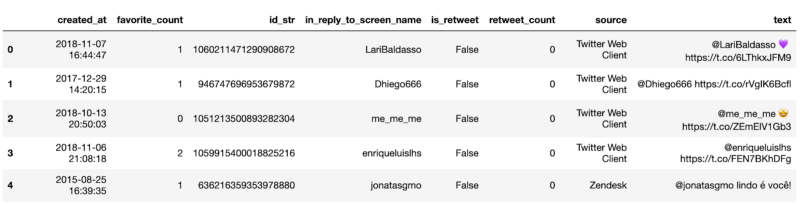
We can see that these are tweets from the bank itself, some are replies to other users. We have some interesting columns: ‘created_at’, ‘favorite_count’ and ‘retweet_count’.
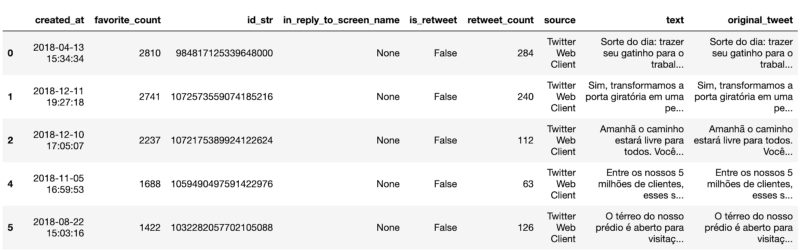
Let’s sort the tweets by ‘favorite_count’ and keep tweets created after January 2018. We’ll need to clean the text, but first we duplicate it and save to a new ‘original_tweet’ column to help us later.
df_nubank = df_nubank.sort_values(by=[‘favorite_count’],ascending=False).copy()
df_nubank = df_nubank.reset_index(drop=True)
df_nubank = df_nubank[df_nubank[‘created_at’] > ‘2018–01–01’]
df_nubank[‘original_tweet’] = df_nubank[‘text’]
df_nubank.head()
Every NLP (Natural Language Processing) pipeline starts with cleaning the text. Let’s do it now!
# Lower case
df_nubank[‘text’] = df_nubank[‘text’].apply(lambda x: “ “.join(x.lower() for x in x.split()))

# Removing usernames
df_nubank[‘text’] = df_nubank[‘text’].str.replace(‘@[^\s]+’,””)

# Removing urls
df_nubank[‘text’] = df_nubank[‘text’].str.replace(‘https?:\/\/.*[\r\n]*’,’’)

# Removing punctuation
df_nubank[‘text’] = df_nubank[‘text’].str.replace(‘[^\w\s]’,’’)

# Removing stopwords
from nltk.corpus import stopwords
stop = stopwords.words(‘portuguese’)
df_nubank[‘text’] = df_nubank[‘text’].apply(lambda x: “ “.join(x for x in x.split() if x not in stop))

# Removing common brazilian names -> you will need a .txt with these, it is easy to find it online
names = pd.read_csv(‘nomes.txt’, encoding=’latin’, header=None)
name_list = (names[0].str.lower()).tolist()
df_nubank[‘text’] = df_nubank[‘text’].apply(lambda x: “ “.join(x for x in x.split() if x not in name_list))

# Removing numbers
df_nubank[‘text’] = df_nubank[‘text’].str.replace(‘\d+’,’’)

# Removing small words -> e.g.: é, tá, lá, pra, etc
df_nubank[‘text’] = df_nubank[‘text’].str.replace(r’\b(\w{1,3})\b’, ‘’)

# Normalizing it
df_nubank.text = df_nubank.text.str.normalize(‘NFKD’)\
 .str.encode(‘ascii’, errors=’ignore’)\
 .str.decode(‘utf-8’)

# Removing empty rows
df_nubank[‘text’].replace(‘’, np.nan, inplace=True)
df_nubank.dropna(subset=[‘text’], inplace=True)

# Let’s keep only the first 10k tweets from our dataframe
df_nubank = df_nubank[:10000]
df_nubank.head()
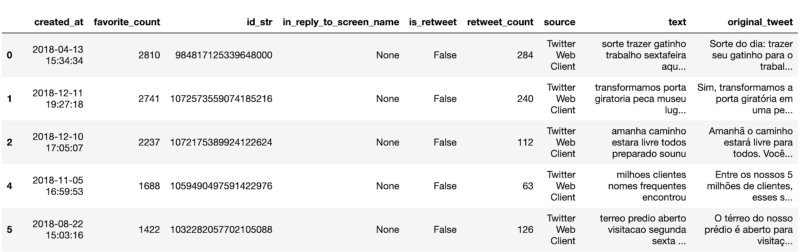
By now you can see how different our ‘text’ column looks in comparison with the ‘original_tweet’.
Let’s proceed to our first visualization: Word Clouds! We are going to use the wordcloud library.
text = “ “.join(review for review in df_nubank.text)
%matplotlib inline
stopwords = set(STOPWORDS)
wordcloud = WordCloud(width = 3000,
                      height = 2000,
                      background_color = ‘black’,
                      stopwords = stopwords).generate(text)
fig = plt.figure(figsize = (40, 30),
                 facecolor = ‘k’,
                 edgecolor = ‘k’)
plt.imshow(wordcloud, interpolation = ‘bilinear’)
plt.axis(‘off’)
plt.tight_layout(pad=0)
plt.show()
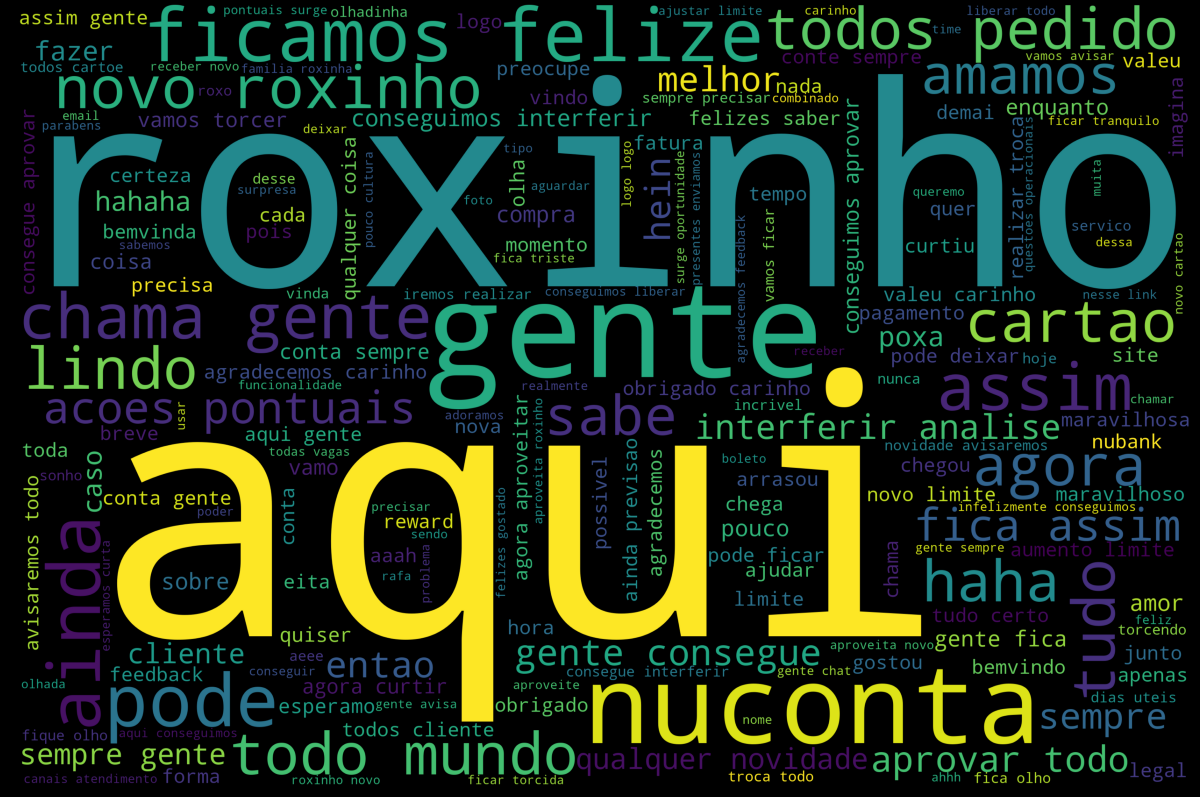
Awesome right?! Let’s do the same for Itaú and proceed to the scattertext!
df_itau = pd.read_json(‘itau_tweets.json’)
# sorting by fav count
df_itau = df_itau.sort_values(by=[‘favorite_count’],ascending=False).copy()
df_itau = df_itau.reset_index(drop=True)
df_itau = df_itau[df_itau[‘created_at’] > ‘2018–01–01’]
df_itau[‘original_tweet’] = df_itau[‘text’]
# Data Cleaning
# Lower case
df_itau[‘text’] = df_itau[‘text’].apply(lambda x: “ “.join(x.lower() for x in x.split()))
# Removing usernames
df_itau[‘text’] = df_itau[‘text’].str.replace(‘@[^\s]+’,””)
# Removing urls
df_itau[‘text’] = df_itau[‘text’].str.replace(‘https?:\/\/.*[\r\n]*’,’’)
# Removing punctuation
df_itau[‘text’] = df_itau[‘text’].str.replace(‘[^\w\s]’,’’)
# Removing stopwords
from nltk.corpus import stopwords
stop = stopwords.words(‘portuguese’)
df_itau[‘text’] = df_itau[‘text’].apply(lambda x: “ “.join(x for x in x.split() if x not in stop))
# Removing common brazilian names -> you will need a .txt with these, it is easy to find it online
names = pd.read_csv(‘nomes.txt’, encoding=’latin’, header=None)
name_list = (names[0].str.lower()).tolist()
df_itau[‘text’] = df_itau[‘text’].apply(lambda x: “ “.join(x for x in x.split() if x not in name_list))
# Removing numbers
df_itau[‘text’] = df_itau[‘text’].str.replace(‘\d+’,’’)
# Removing small words -> e.g.: é, tá, lá, pra, etc
df_itau[‘text’] = df_itau[‘text’].str.replace(r’\b(\w{1,3})\b’, ‘’)
# Normalizing it
df_itau.text = df_itau.text.str.normalize(‘NFKD’)\
 .str.encode(‘ascii’, errors=’ignore’)\
 .str.decode(‘utf-8’)
# Removing empty rows
df_itau[‘text’].replace(‘’, np.nan, inplace=True)
df_itau.dropna(subset=[‘text’], inplace=True)
# Using only the first 10k tweets
df_itau = df_itau[:10000]
text_itau = “ “.join(review for review in df_itau.text)
# Wordcloud
stopwords = set(STOPWORDS)
wordcloud = WordCloud(width = 3000,
                      height = 2000,
                      background_color = ‘black’,
                      stopwords = stopwords).generate(text_itau)
fig = plt.figure(figsize = (40, 30),
                 facecolor = ‘k’,
                 edgecolor = ‘k’)
plt.imshow(wordcloud, interpolation = ‘bilinear’)
plt.axis(‘off’)
plt.tight_layout(pad=0)
plt.show()
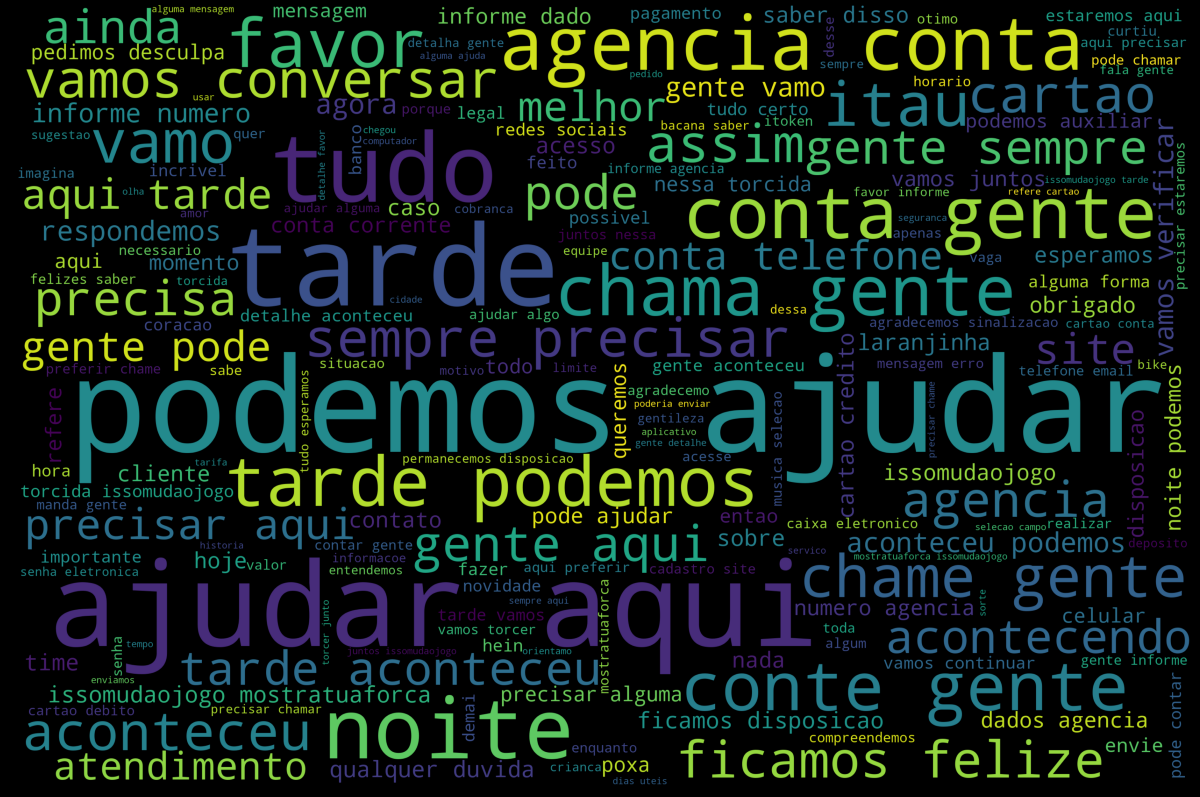
Word clouds are not the best way of interpreting the data. Comparing sizes and intensities of colors is not straight forward.
Scattertext
From the github repository:
“A tool for finding distinguishing terms in small-to-medium-sized corpora, and presenting them in a sexy, interactive scatter plot with non-overlapping term labels. Exploratory data analysis just got more fun.”
We will use it to create a scatter plot of the words based on the frequency and without overlapping the labels.
Let’s combine both categories and use the ‘created_at’ and ‘original_tweet’ columns as metadata.
df_nubank[‘bank’] = ‘nubank’
df_nubank[‘metadata’] = df_nubank.created_at.map(str) + “ | “ + df_nubank.original_tweet
df_nubank = df_nubank[[‘metadata’, ‘bank’, ‘text’]]
df_itau[‘bank’] = ‘itau’
df_itau[‘metadata’] = df_itau.created_at.map(str) + “ | “ + df_itau.original_tweet
df_itau = df_itau[[‘metadata’, ‘bank’, ‘text’]]
df_scatter = df_nubank.append(df_itau)
Creating the scatter plot
import scattertext as st
import spacy
nlp = spacy.load(‘pt’)
corpus = (st.CorpusFromPandas(df_scatter,
          category_col=’bank’,
          text_col=’text’,
          nlp=nlp)
          .build()
          .get_unigram_corpus()
          .compact(st.ClassPercentageCompactor(term_count=1,
                                               term_ranker=st.OncePerDocFrequencyRanker)))
html = st.produce_scattertext_explorer(corpus,
                                       category=’nubank’,
                                       category_name=’Nubank’,
                                       not_category_name=’Itaú’,
                                       width_in_pixels=1000,
                                       metadata=corpus.get_df()[‘metadata’])
open(“visualization_nubank_itau.html”, ‘wb’).write(html.encode(‘utf-8’))
Exploring the Scattertext html file
The code above generates an .html file. You can access a live version on this link, but I will post some screenshots to illustrate.
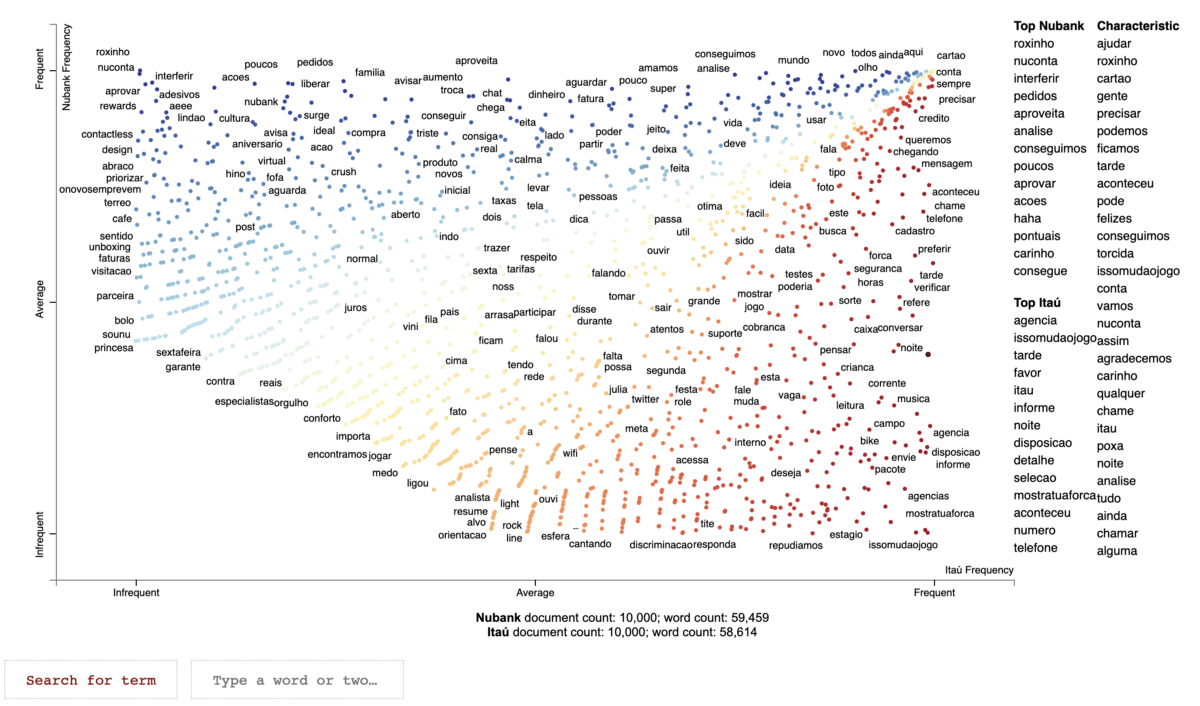
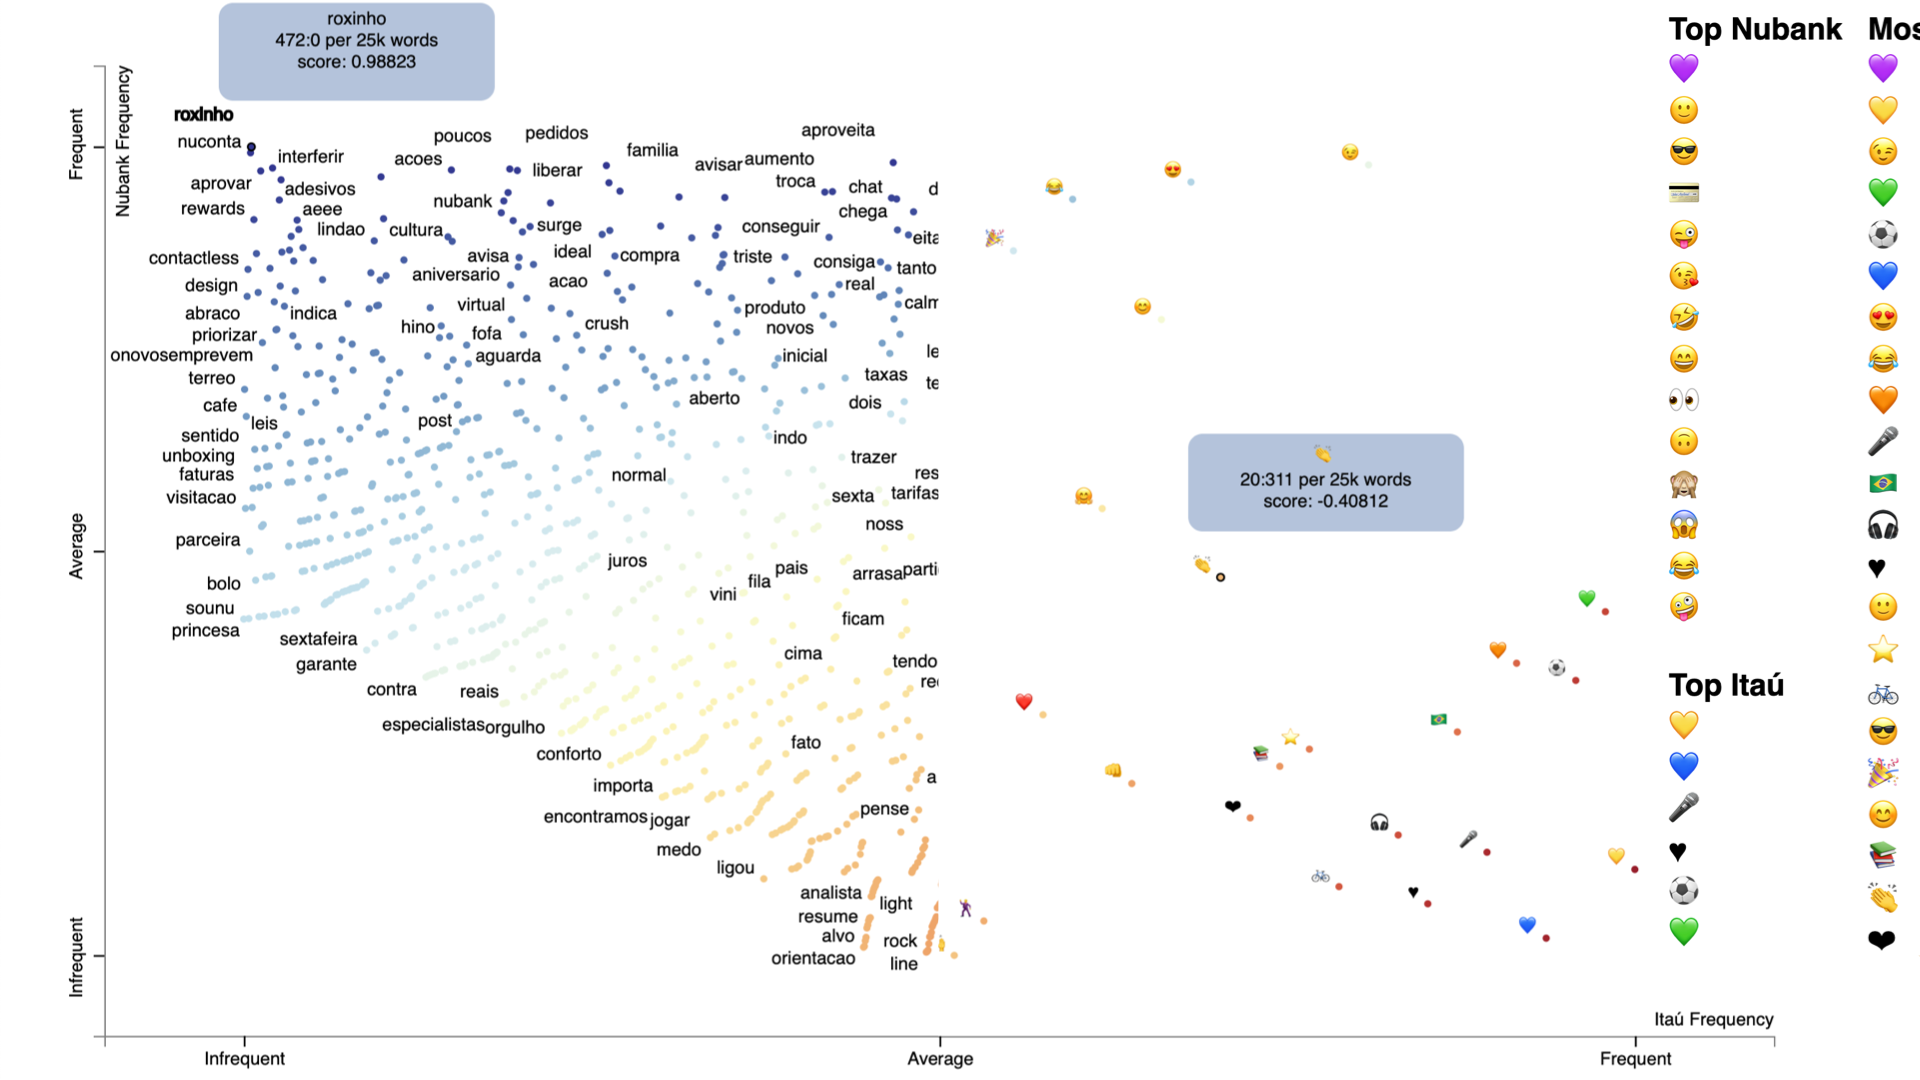
On the top-left corner you can see the words used more by Nubank and less by Itaú. On the bottom-right corner you see the words used more by Itaú and less by Nubank.
Bottom-left corner shows the least frequent terms and top-right corner the most frequent ones.
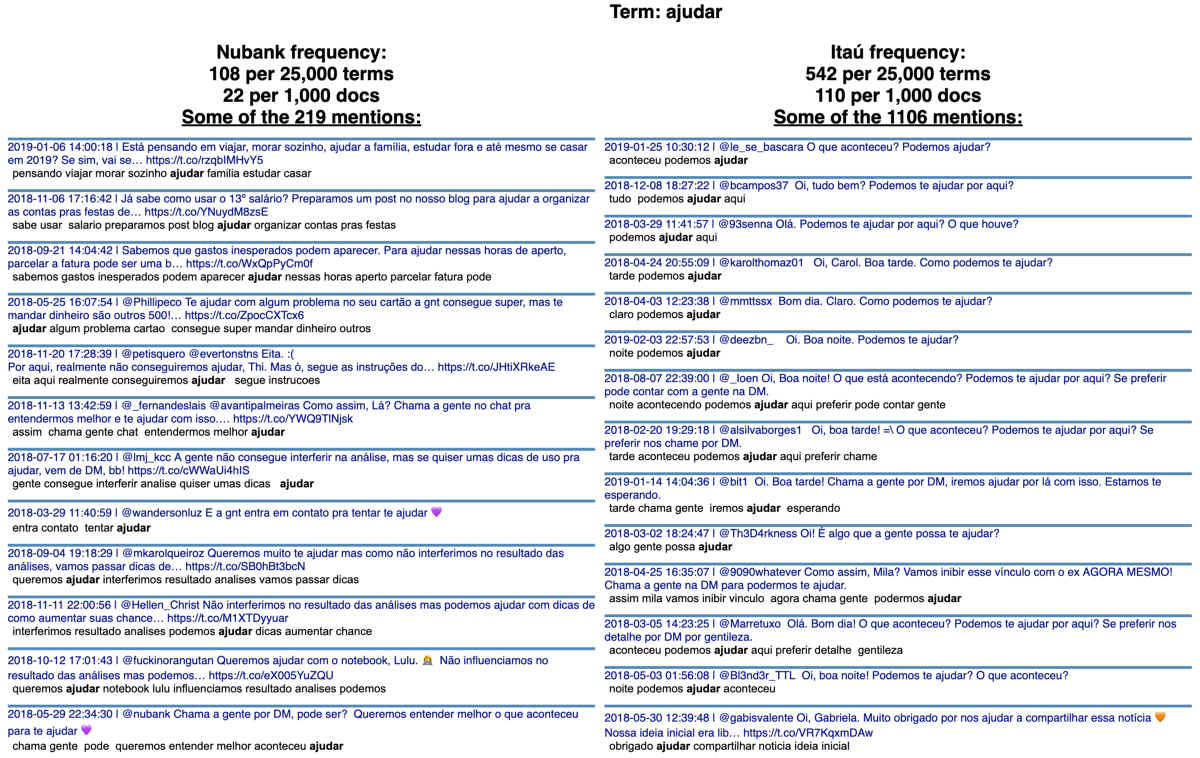
Searching for specific terms
We can see that ‘ajudar’ (help in Portuguese) is the most characteristic word of this corpus. You can click on the word or type it on the search box and see the frequency it appears in each category.
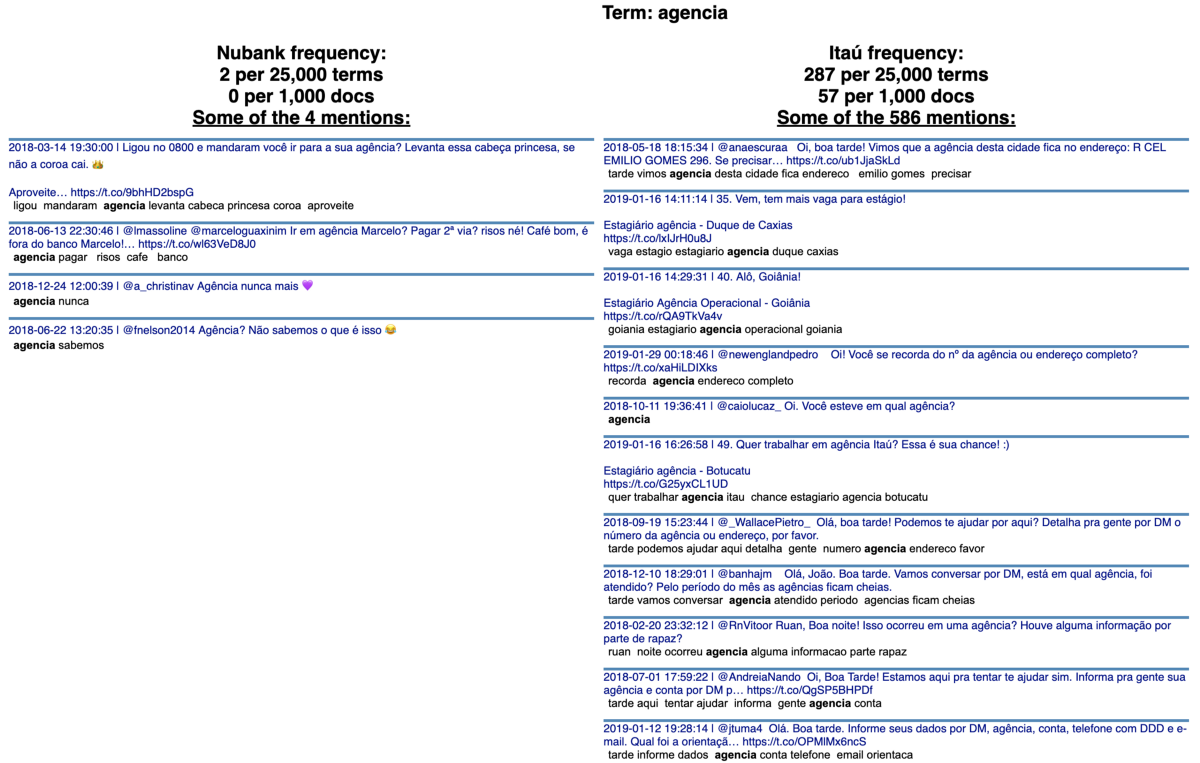
The term ‘agência’ (agency in Portuguese) is the top term from Itaú, appearing 586 times. It appears only 4 times in the Nubank category.
Itaú was founded in January 2, 1945, while Nubank was founded in May 6, 2013. It is reasonable that we find contrasts like this.
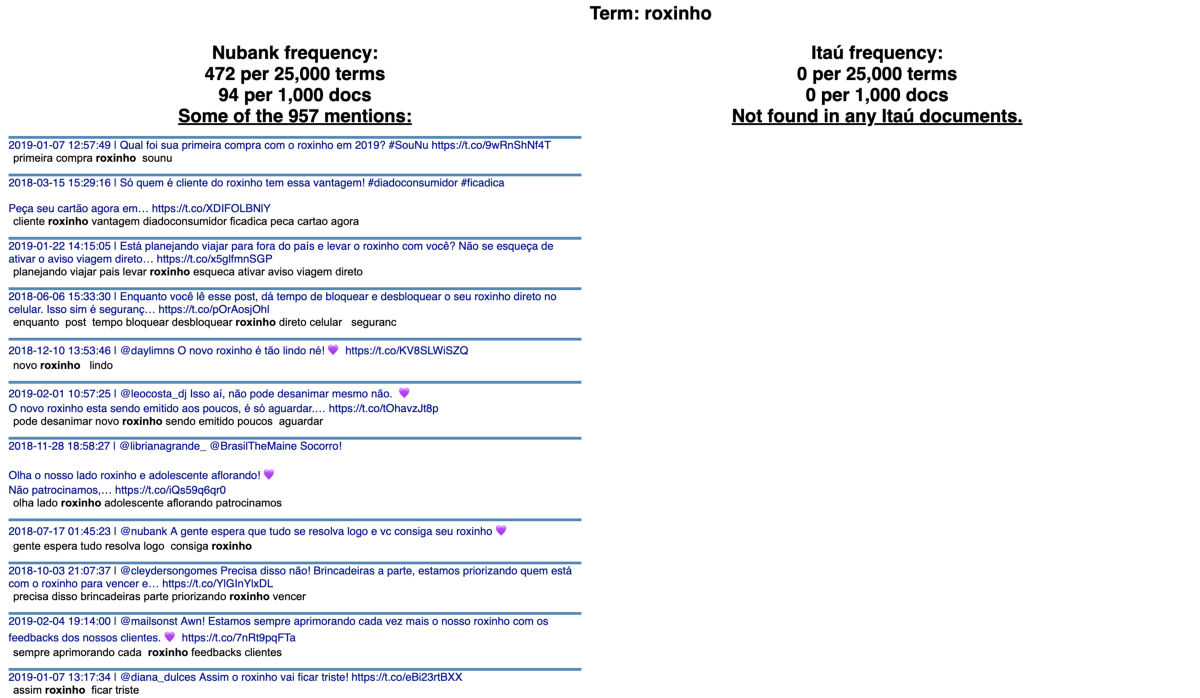
The term ‘roxinho’ (a cute way of saying purple in Portuguese) is the top term from Nubank. The bank uses this word as a nickname for their flagship product: their credit card.
Emoji analysis
Scattertext introducing text says:
“Exploratory data analysis just got more fun.”
Let’s take fun to the next level, we will compare the emoji on the tweets from both banks! Play with the live version on this link.
corpus = st.CorpusFromParsedDocuments(df_scatter,
                                      parsed_col=’metadata’,
                                      category_col=’bank’,
                                      feats_from_spacy_doc=st.FeatsFromSpacyDocOnlyEmoji()).build()
html = st.produce_scattertext_explorer(corpus,
                                       category=’nubank’,
                                       category_name=’Nubank’,
                                       not_category_name=’Itaú’,
                                       metadata=(corpus.get_df()[‘metadata’]),
                                       width_in_pixels=1000)
open(“emoji_nubank_itau.html”, ‘wb’).write(html.encode(‘utf-8’))
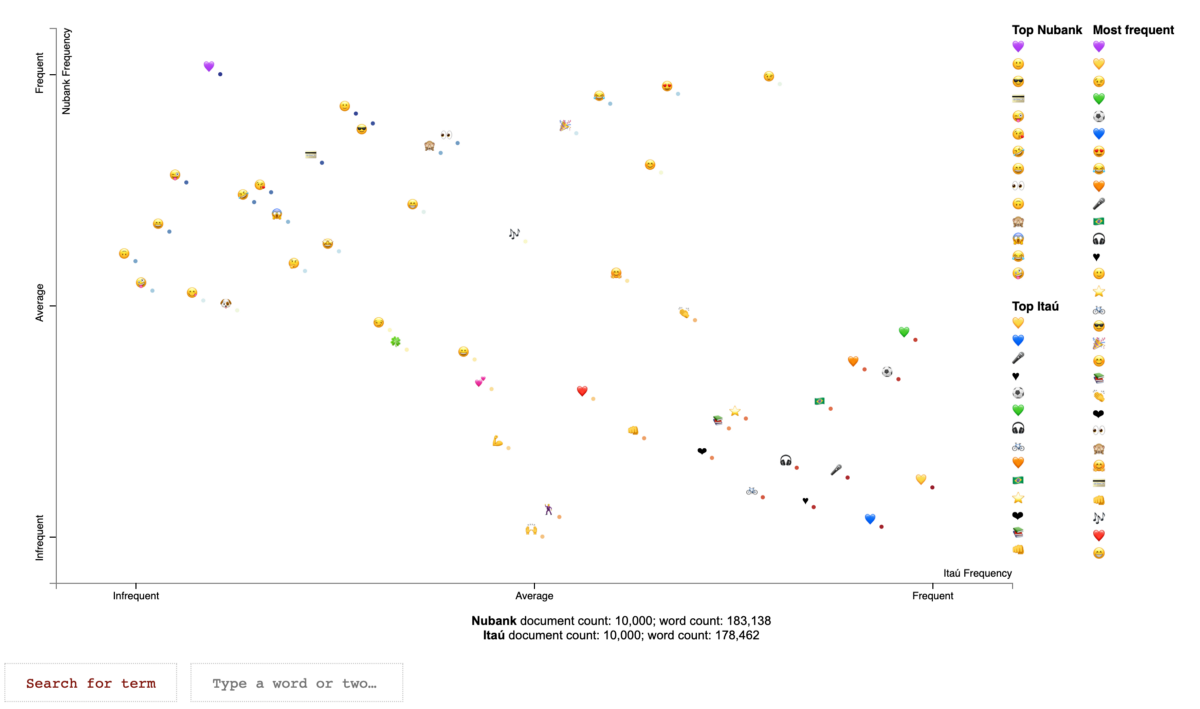
A scatter plot of emoji based on their frequency of use. How awesome is that?!
We see hearts everywhere, but a clear distinction between their color. Keep in mind that we filtered the tweets only for those starting from January 2018, and 2018 was a World Cup year.
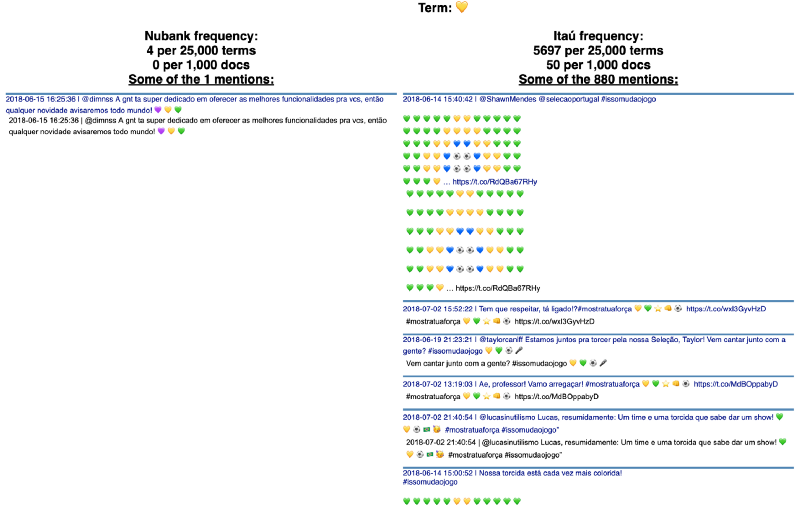
The color of the hearts from Itaú were most from the Brazilian flag and the bank’s main color: orange. The bank is an official sponsor of the Brazilian Soccer Team.
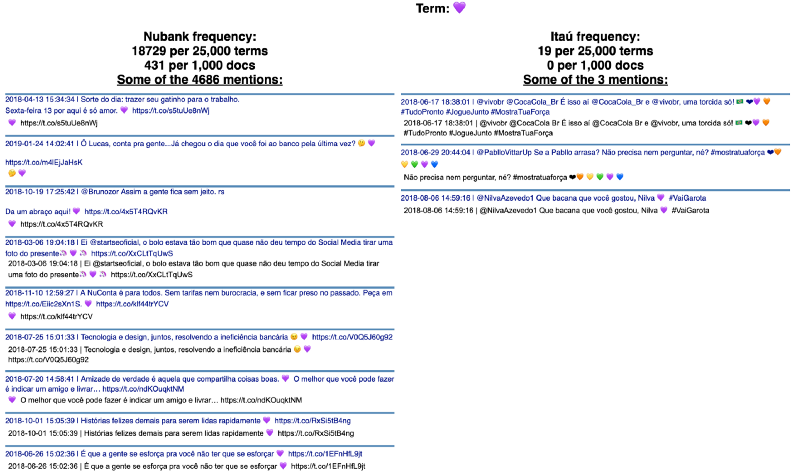
The hearts from Nubank followed the signature color of the brand: purple.
Wrapping up
Play around with the plots to see how powerful they are. If you liked this article, recommend it and share it with your friends.
Disclaimer
This analysis was done based on public available data from the brand’s social media channels to illustrate the application of an algorithm developed by our engineers. We don’t have any affiliation with those brands.
Citation for the Scattertext library:
Jason S. Kessler. Scattertext: a Browser-Based Tool for Visualizing how Corpora Differ. ACL System Demonstrations. 2017.